NUFEB Simulation Analysis
Get Simulation Data
-
class
nufeb_tools.utils.get_data(directory=None, id=None, test=None, timestep=10)[source] Bases:
objectCollect results for analysis.
NUFEB simulation data class to collect results for analysis
-
biomass Pandas Dataframe containing the biomass vs time data from biomass.csv
- Type
-
ntypes Pandas Dataframe containing the cell number vs time data from ntypes.csv
- Type
-
avg_con Pandas Dataframe containing the average nutrient concentrations vs time data from avg_concentration.csv
- Type
-
positions Pandas Dataframe containing the single cell biomass over time of all cell ids present at the timepoint
- Type
-
convert_units_avg_con()[source] Convert the object attribute avg_con, which contains the average nutrient concentration, units to hours and mM.
-
convert_units_biomass()[source] Convert the object attribute biomass units to hours and femtograms.
-
collect_positions(h5)[source] Extract the x, y, z position of each cell during the simulation.
- Parameters
timepoint (int) – The simulation timestep to get the position data from.
- Returns
Dataframe containing Timestep, ID, type, radius, x, y, z columns
- Return type
-
get_neighbor_distance(id, timepoint)[source] Get the nearest neighbor cell distances
- Parameters
- Returns
Dataframe containing ID, type, Distance
- Return type
-
get_neighbors(timestep)[source] Get the nearest neighbor cell distances
- Parameters
timestep (int) – The timepoint to check the neighbor distances from
- Returns
Pandas dataframe containing pairwise neighbor distances
- Return type
pd.DataFrame
-
get_mothers__old()[source] Assign mother cells based on initial cells in the simulation.
- Returns
Dataframe containing ID, type, position, radius, and mother_cell
- Return type
-
get_mothers()[source] Assign mother cells based on initial cells in the simulation.
- Returns
Dataframe containing Timestep, ID, type, position, radius, biomass, total biomass, and mother_cell
- Return type
-
count_colony_area(timestep)[source] Count the 2d area in pixel dimensions of each colony at a given timestep.
- Parameters
timestep (int) – Timestep to count
-
Spatial Analysis
-
nufeb_tools.spatial.fitness_metrics(obj)[source] Function to calculate colony-level fitness metrics.
Mother cell: Cell ID which seeded the colony
Type: Cell type - cyanobacteria are type 1 and E. coli are type 2
Voronoi area: Area of species-specific Voronoi Tesselation at the beginning of the simulation
IPTG: Sucrose induction level
total biomass: Biomass of each colony at the end of the simulation (fg)
Nearest 1: Distance to nearest cyanobacteria colony
Nearest 2: Distance to nearest E. coli colony
Nearest Neighbor: Distance to nearest colony
IC1: Average distance to nearest cyanobacteria colony
IC2: Average distance to nearest E. coli colony
IC: Average distance to nearest colony
Relative Neighbor Dist 1: Distance to nearest cyanobacteria colony divided by IC1
Relative Neighbor Dist 2: Distance to nearest E. coli colony divided by IC2
Relative Neighbor Dist: Distance to nearest colony divided by IC
Z1: Relative neighbor distance 1 divided by sqrt(D_sucrose/mu_cyano)
Z2: Relative neighbor distance 2 divided by sqrt(D_sucrose/mu_ecw)
Z1_2: Relative neighbor distance 1 divided by sqrt(D_sucrose/mu_ecw)
Z2_1: Relative neighbor distance 2 divided by sqrt(D_sucrose/mu_cyano)
LogNearest 1: log(Nearest 1)
LogNearest 2: log(Nearest 2)
LogNearest: log(Nearest Neighbor)
Inv1: Inverse sum of neighbor distance 1
Inv2: Inverse sum of neighbor distance 2
Log Inv1: Log squared inverse sum of neighbor distance 1
Log Inv2: Log squared inverse sum of neighbor distance 2
Colony Area: 2D area of colony at the end of the simulation
- Parameters
obj (nufeb_tools.utils.get_data) – Data object collected with nufeb_tools.utils.get_data
- Returns
Dataframe containing colony number (mother cell ID), cell type, total biomass, colony area, Voronoi area, nearest neighbor, mean neighbor distance, etc.
- Return type
from nufeb_tools import utils, spatial
x = utils.get_data(directory = None,test=True)
metrics = spatial(x)
metrics.head()
mother_cell |
type |
Voronoi Area |
sucRatio |
total biomass |
Nearest 1 |
Nearest 2 |
Nearest Neighbor |
IC1 |
IC2 |
IC |
Relative Neighbor Dist 1 |
Relative Neighbor Dist 2 |
Relative Neighbor Dist |
Z1 |
Z2 |
Z1_2 |
Z2_1 |
LogNearest 1 |
LogNearest 2 |
LogNearest |
Inv1 |
Inv2 |
Log Inv1 |
Log Inv2 |
Colony Area |
|
|---|---|---|---|---|---|---|---|---|---|---|---|---|---|---|---|---|---|---|---|---|---|---|---|---|---|---|
0 |
17 |
1 |
1.3721664010759044e-10 |
56 |
3274.0540292160968 |
1.2218809270955987e-05 |
1.5250550809724869e-05 |
1.2218809270955987e-05 |
8.35779934739048e-06 |
7.427405876587581e-06 |
5.678714310045285e-06 |
1.4619648980650646 |
2.0532809251473845 |
2.151685857719887 |
525.1659178645756 |
367.9636654080846 |
261.9953051730434 |
737.578011015187 |
-11.312534049970473 |
-11.090894936892633 |
-11.312534049970473 |
81841.03522893938 |
65571.40213993627 |
22.625068099940947 |
22.181789873785267 |
2860.0 |
1 |
9 |
1 |
3.199399919849626e-09 |
56 |
2366.4452758679004 |
9.12914563362859e-06 |
4.715400301140931e-06 |
4.715400301140931e-06 |
8.35779934739048e-06 |
7.427405876587581e-06 |
5.678714310045285e-06 |
1.092290596385153 |
0.6348650362577677 |
0.8303640654715958 |
392.3717966037814 |
113.77267616903244 |
195.7468394188747 |
228.05573507798357 |
-11.6040384456519 |
-12.264676745982944 |
-12.264676745982944 |
109539.27564879112 |
212071.07268454845 |
23.2080768913038 |
24.52935349196589 |
1826.0 |
2 |
18 |
1 |
0.0 |
56 |
4237.0059685613915 |
1.7105525423090635e-05 |
2.763856002037732e-06 |
2.763856002037732e-06 |
8.35779934739048e-06 |
7.427405876587581e-06 |
5.678714310045285e-06 |
2.046654234219133 |
0.3721159241815324 |
0.4867045340084544 |
735.1975761440449 |
66.68602320392425 |
366.77611164784554 |
133.6711990373123 |
-10.97610902249168 |
-12.798883751086846 |
-12.798883751086846 |
58460.64211802033 |
361813.35035643005 |
21.95221804498336 |
25.597767502173692 |
3618.0 |
3 |
11 |
1 |
9.405959110956312e-09 |
56 |
3532.419993283879 |
2.4033751267748442e-05 |
5.813811142443484e-06 |
5.813811142443484e-06 |
8.35779934739048e-06 |
7.427405876587581e-06 |
5.678714310045285e-06 |
2.8756075934333594 |
0.78275123765211 |
1.0237900385584147 |
1032.973570858309 |
140.2750159423561 |
515.330901580897 |
281.1793037748489 |
-10.636051412711192 |
-12.055274239595036 |
-12.055274239595036 |
41608.153003643994 |
172004.2112650585 |
21.272102825422383 |
24.110548479190072 |
2623.0 |
4 |
8 |
1 |
1.0844410415183224e-09 |
56 |
4543.177970151615 |
1.648329154022339e-05 |
6.4671554798071755e-06 |
6.4671554798071755e-06 |
8.35779934739048e-06 |
7.427405876587581e-06 |
5.678714310045285e-06 |
1.9722047461416858 |
0.8707152385724235 |
1.1388414924073902 |
708.4538877063212 |
156.03883851830264 |
353.4341932648232 |
312.7776652290108 |
-11.013163324043719 |
-11.948774193758952 |
-11.948774193758952 |
60667.494569258066 |
154627.48701842187 |
22.026326648087437 |
23.897548387517904 |
3200.0 |
Plotting
Average Nutrient Concentration
-
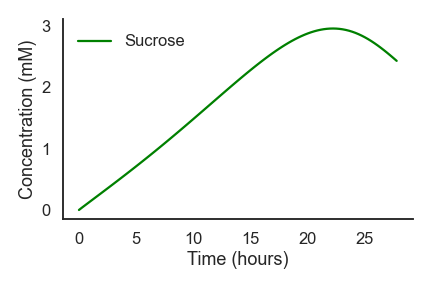
nufeb_tools.plot.average_nutrients(df, nutrient, ax=None, legend=None, **kwargs)[source] This is a function to plot the nutrient concentration over time
- Parameters
df (pandas.DataFrame) – Pandas Dataframe containing nutrient data
nutrient (str) – Name of the nutrient to plot, e.g.,
'Sucrose'ax – Axis on which to make the plot
legend (bool) – Include legend in the plot
**kwargs – Additional arguments to pass to plt.plot
from nufeb_tools import utils, plot
import matplotlib.pyplot as plt
import seaborn as sns
x = utils.get_data(directory = None,test=True)
f, ax = plt.subplots()
sns.set_context('talk')
sns.set_style('white')
plot.average_nutrients(x.avg_con,'Sucrose',color='Green',legend=True)
Single Cell Growth
-
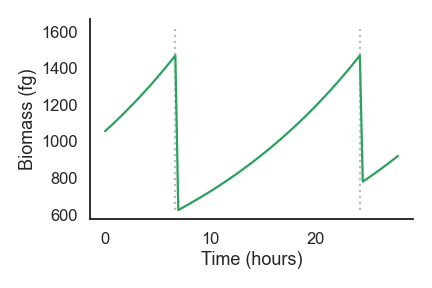
nufeb_tools.plot.biomass_time(df, id=None, ax=None, legend=None, **kwargs)[source] This is a function to plot the cell biomass over time
- Parameters
df (pandas.DataFrame) – Pandas Dataframe containing biomass data
ax – Axis on which to make the plot
legend (bool) – Include legend in the plot
**kwargs – Additional arguments to pass to plt.plot
from nufeb_tools import utils, plot
import matplotlib.pyplot as plt
import seaborn as sns
f, ax = plt.subplots()
sns.set_context('talk')
sns.set_style('white')
x = utils.get_data(directory = None,test=True)
plot.biomass_time(x.positions)
f.tight_layout()
Single Cell Growth Rate
-
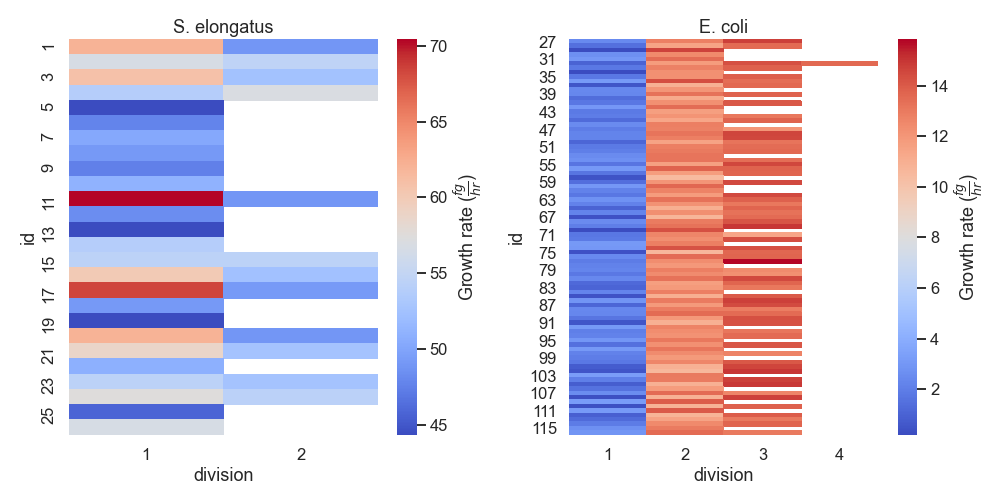
nufeb_tools.plot.growth_rate_div(df, **kwargs)[source] Plot a heatmap of the single cell growth rates relative to each division
- Parameters
df (pandas.DataFrame) – Pandas Dataframe containing biomass data
**kwargs – Additional arguments to pass to plt.plot
-
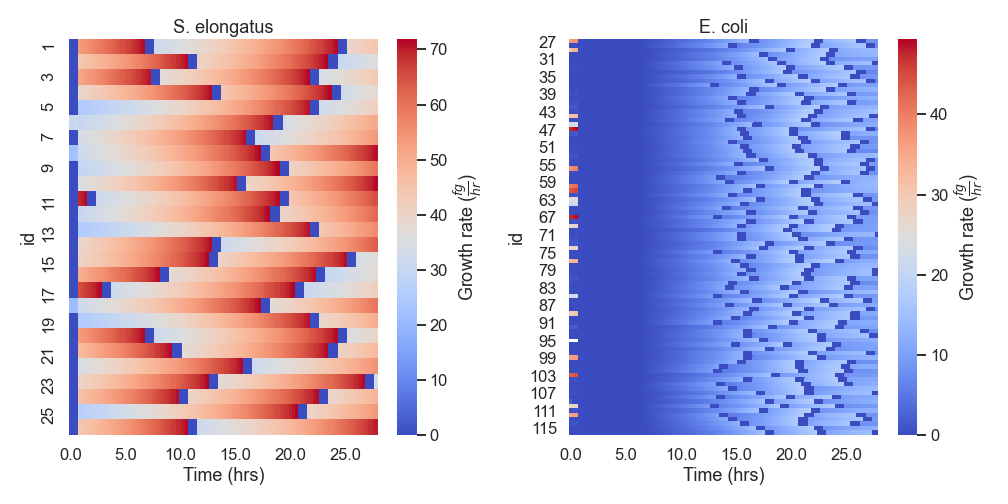
nufeb_tools.plot.growth_rate_time(df, period=3)[source] Plot a heatmap of the single cell growth rates over time
- Parameters
df (pandas.DataFrame) – Pandas Dataframe containing biomass data
period (int) – Number of timesteps to average growth rate calculation over
**kwargs – Additional arguments to pass to plt.plot
- Returns
matplotlib.figure.Figure
from nufeb_tools import utils, plot
import matplotlib.pyplot as plt
x = utils.get_data(directory = None,test=True)
plot.growth_rate_div(x.positions)
from nufeb_tools import utils, plot
import matplotlib.pyplot as plt
x = utils.get_data(directory = None,test=True)
plot.growth_rate_time(x.positions)
Overall Cell Growth
-
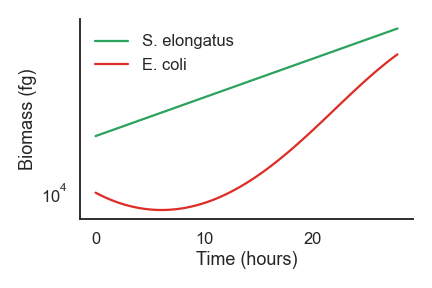
nufeb_tools.plot.overall_growth(df, ax=None, **kwargs)[source] This is a function to generate growth curve plots
- Parameters
df (pandas.DataFrame) – Pandas Dataframe containing biomass data over time
ax (plt.ax) – Axis to plot data on
**kwargs –
from nufeb_tools import utils, plot
import matplotlib.pyplot as plt
import seaborn as sns
sns.set_style('white')
sns.set_context('talk')
f, ax = plt.subplots()
x = utils.get_data(directory = None,test=True)
plot.overall_growth(x.biomass,ax=ax)
f.tight_layout()
Whole Colony Plotting
-
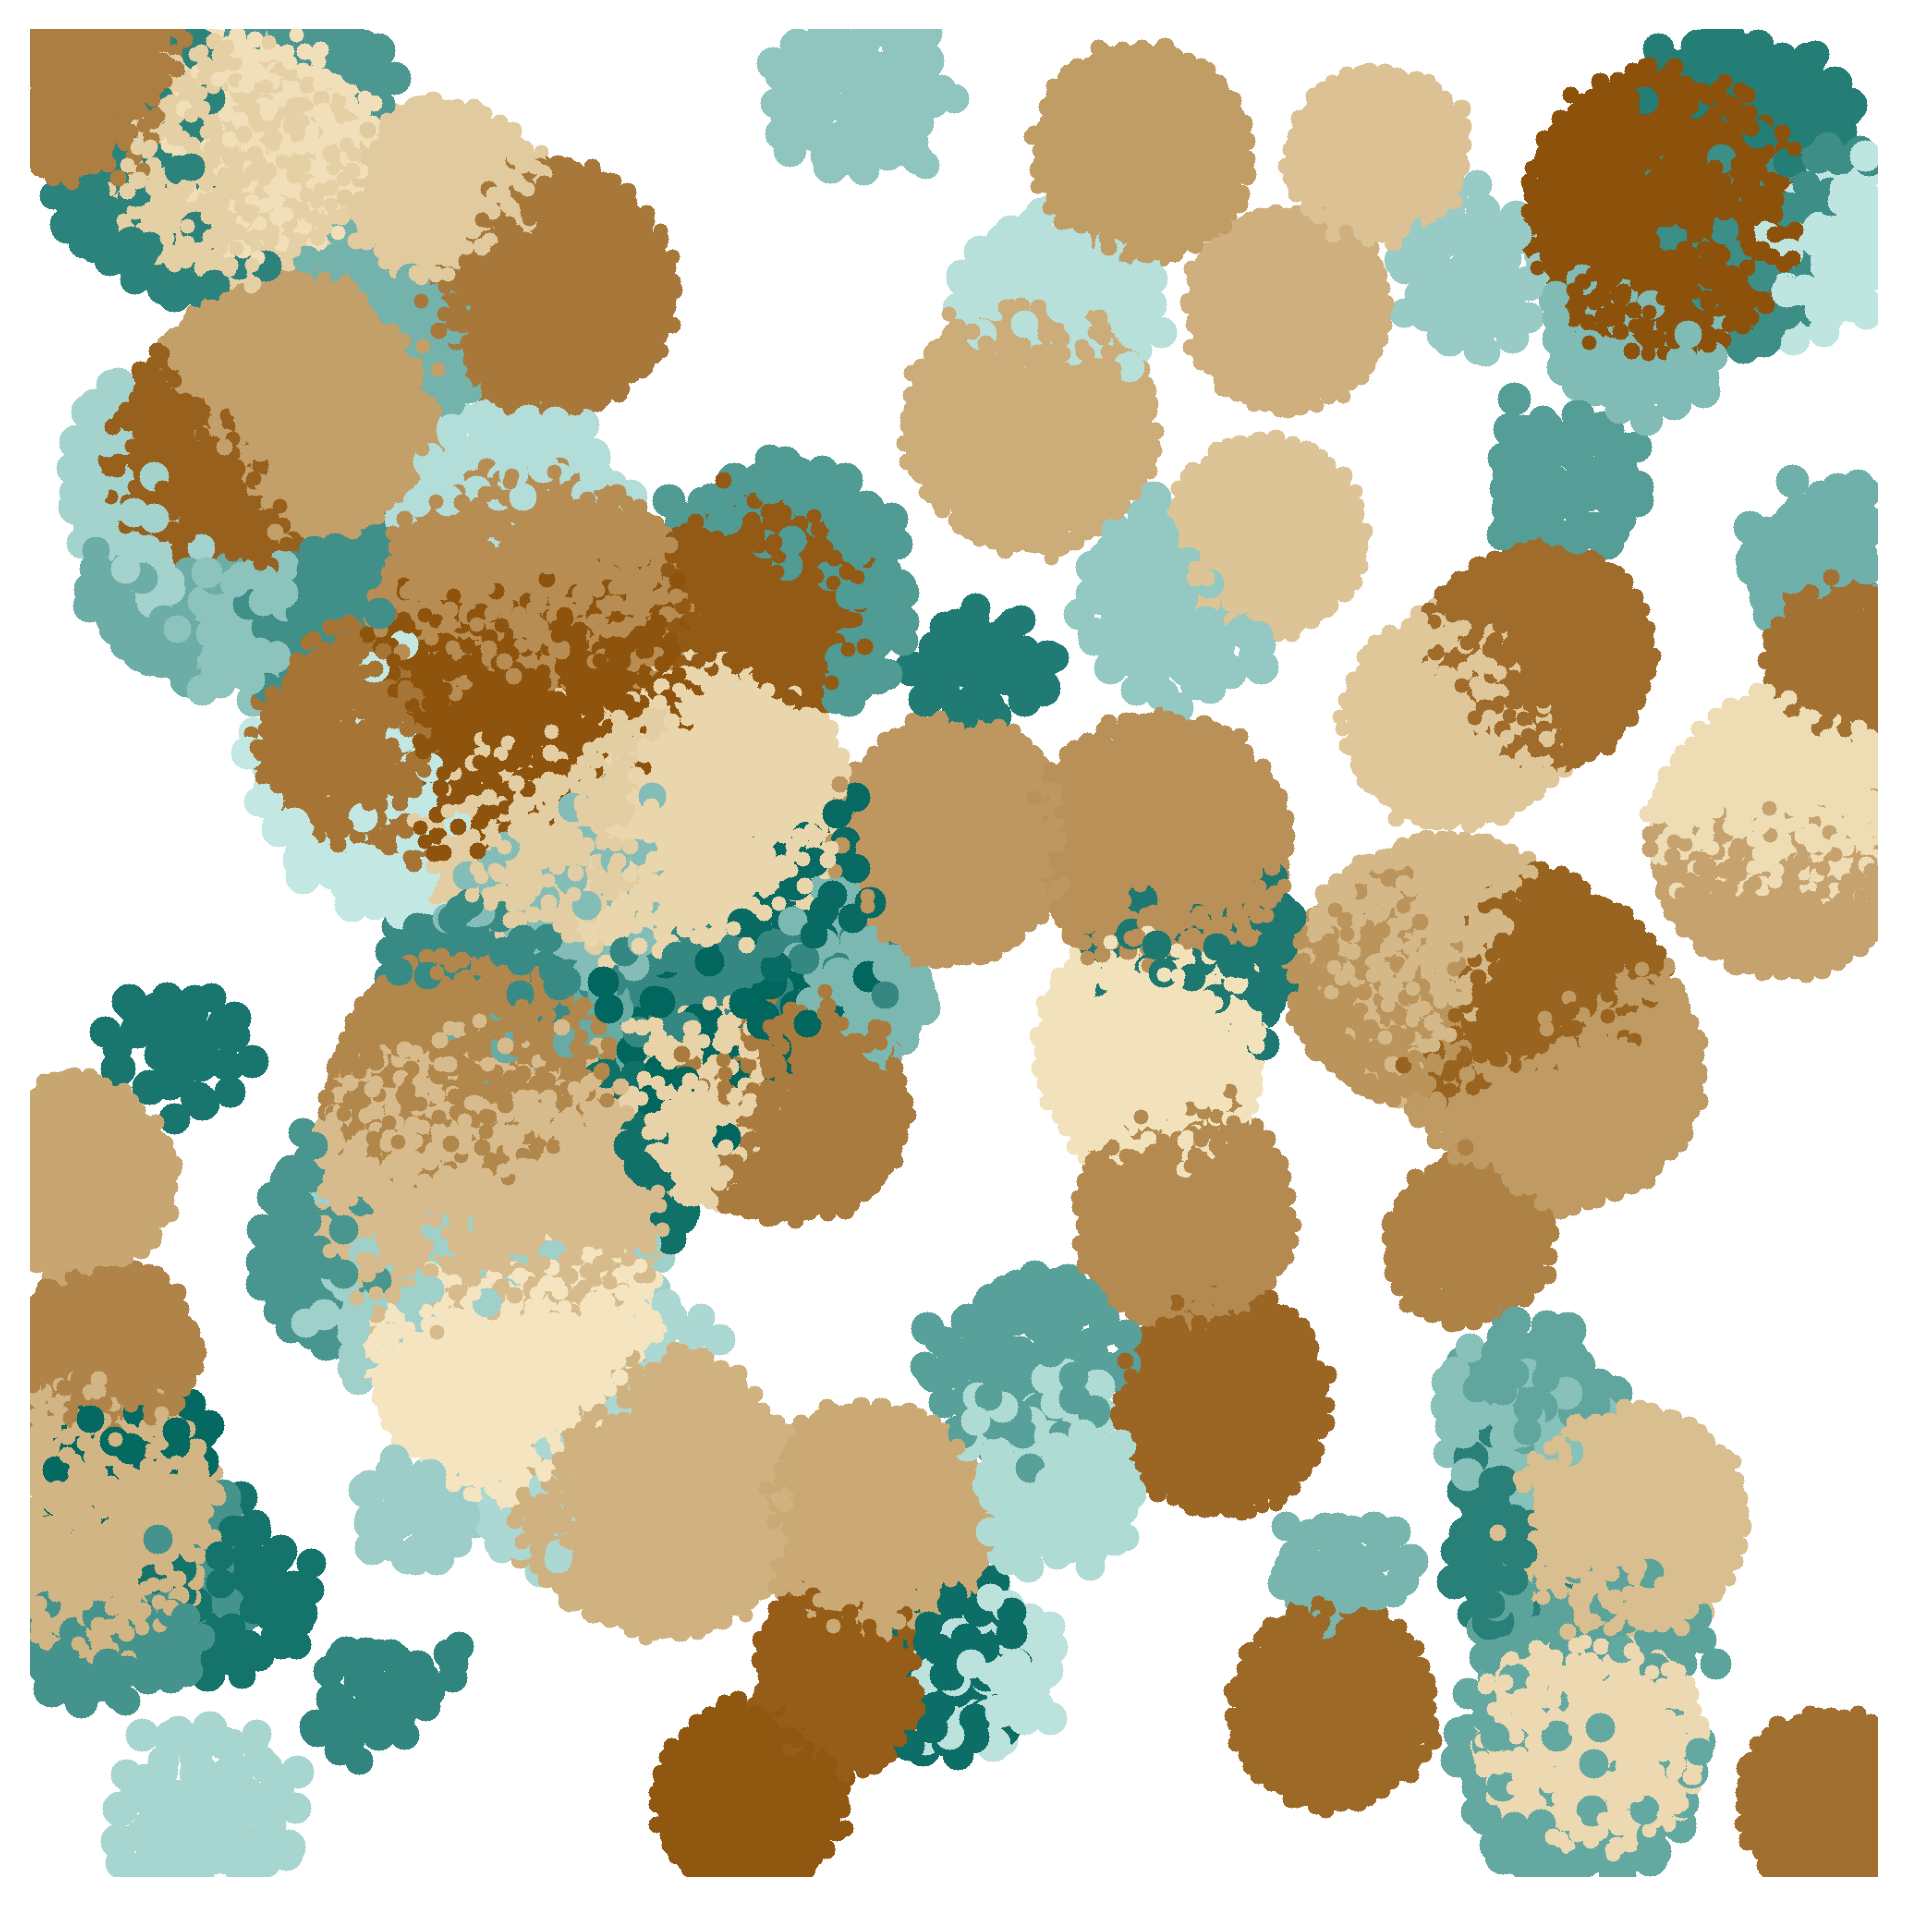
nufeb_tools.plot.colony(obj, time, colors=None, colony=None, ax=None, by=None, img=array([], dtype=float64), fitness=None, overlay=None, **kwargs)[source] Plot bacterial colonies at a specific timepoint
- Parameters
obj (nufeb_tools.utils.get_data) – Object containing cell locations
time (int) – Simulation timestep to plot
colors (dict, optional) – Dictionary of colors to plot each colony. Defaults to random.
colony (int, optional) – Plot a specific colony. Defaults to None.
ax (matplotlib.pyplot.axes, optional) – Axis to plot on. Defaults to None.
by (str, optional) – Plot by species. Defaults to None.
img (np.array, optional) – Image array to overlay colonies onto.
fitness (pandas.DataFrame,optional) – Takes a dataframe containing spatial metrics data as an input or if bool, will calculate the metrics internally. Defaults to None.
overlay (bool, optional) – If True, plot a specific colony on top of the others.
from nufeb_tools import utils, plot
import matplotlib.pyplot as plt
x = utils.get_data(directory=r'E:\sucrose\runs\Run_50_50_1.00e+00_1_2022-01-11_48525')
f,ax = plt.subplots()
plot.colony(x,35000,colors,ax=ax)
plt.show()
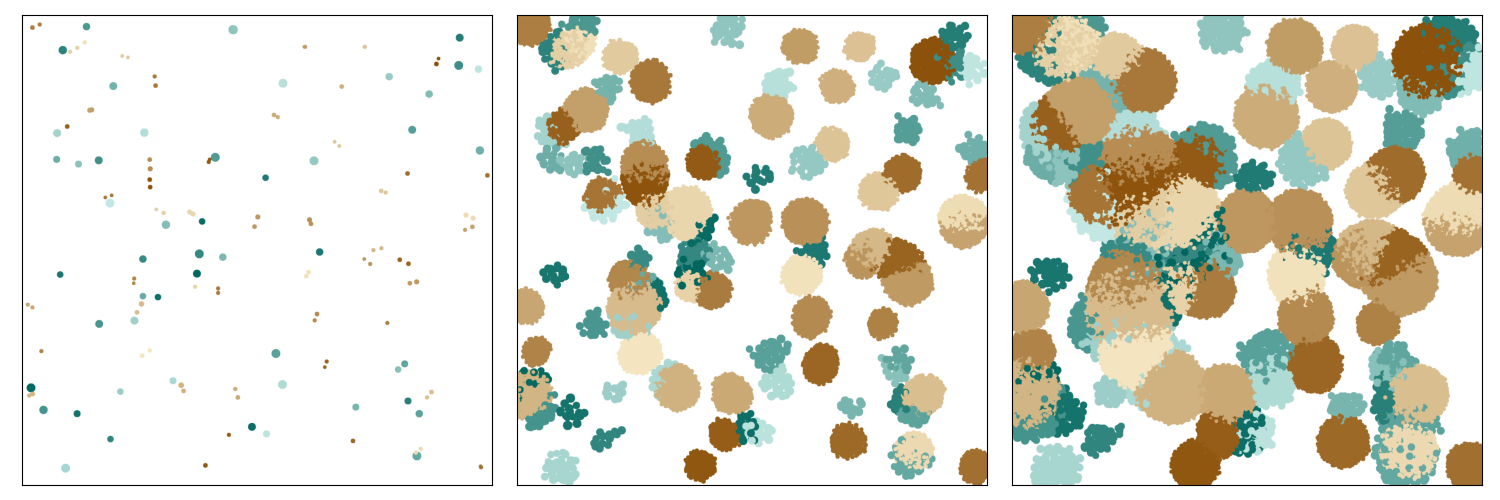
Plot colonies over time by species:
from nufeb_tools import utils, plot
import matplotlib.pyplot as plt
x = utils.get_data(directory=r'E:\sucrose\runs\Run_50_50_1.00e+00_1_2022-01-11_48525')
f, axes = plt.subplots(ncols=3,figsize=(15,5))
for ax, time in zip(axes,[100,20000,25900]):
    plot.plot_colony(x,time,by='Species',ax=ax)
plt.show()